Analysis of Seattle’s Airbnb Data


Motivation#
This article is a part of the Udacity’s Data Science Nanodegree that gives a nice repetition of Data Science process and stakeholder communication, i.e. leaving presence on github in technical terms, and also covering writing a blog post to communicate business problems and insights that are derived from data.
My data set of choice is Airbnb Seattle data. Before I start with the questions and insights that I derived from the analysis of data, I would like to write few sentences on what kind of a company is Airbnb, for the very few of you that have never heard about it.
Airbnb, Inc.is an online marketplace for arranging or offering lodging, primarily homestays, or tourism experiences. The company does not own any of the real estate listings, nor does it host events; it acts as a broker, receiving commissions from each booking. The company is based in San Francisco, California, United States.
Let’s begin by asking questions and interpreting results of the analysis.
1st Question#
How much AirBnB homes are earning per month in specific neighborhood areas? When do the prices spike?
Analyzing the AirBnB listings data it is evident that average listings price (in US dollars) is having a “bump” window (Figure 1) that starts increasing in all neighborhoods, in different degrees approximately in month of May. Peaking months are between June and August with a maximum peak in July.
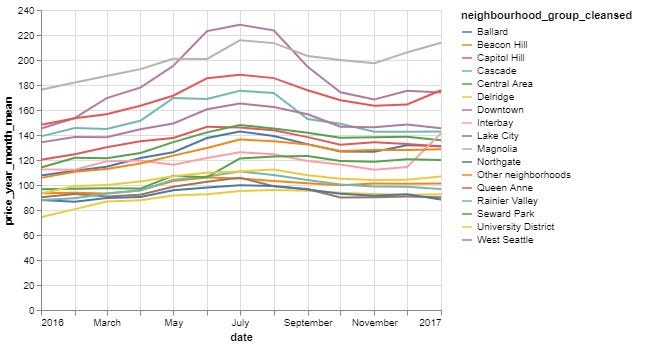
Figure 1: Development of average listing prices (in dollars) that are grouped by per Month in a Year, and Neighborhood group.
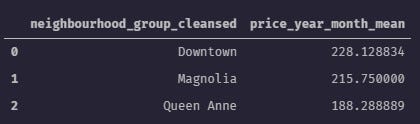
Figure 2: Top three neighborhoods by average monthly price in dollars.
From Figure 1 we can observe which neighborhoods have the highest listings prices. Figure 2. highlights top 3 neighborhoods, Downtown, Magnolia and Queen Anne that have monthly average prices between 188–228 US dollars. If we compare it with the lowest listing price during the peak months, there is approximately 2–3 fold price difference.
2nd Question#
What are the busiest times of the year to visit Seattle?
Based on the data (Figure 3), first five months have highest number of listings closing to a count of 3000, dropping from May over the summer and starting to raise again from August onward, in a linear fashion, from 2500 to close to 3000.
Focusing on the trends there are two increasing trends, first one in first 5 months, and second one after the summer until the end of the year, crossing into the January 2017. Period between May and August marks the trend of acount decline.

Figure 3: Count of listings aggregated per month.

Figure 4: Top 3 months based on the counts of listings.
Summary table (Figure 4) lists top 3 months in the year with the highest listing counts, January, March and April 2016 with 2931, 2950 and 3002 listings respectively.
Could we assume that tourists are targeting more southern states when visiting USA during the spring and summer, where average temperatures are higher and the weather is more nicer? It might be worth investigating why, by incorporating different data.
3rd question#
Are there any correlations between any of the numerical attributes and the mean monthly price of listings?
By analyzing the correlation matrix of the numerical data attributes from Seattle’s AirBnB data (Figure 5), and focusing only on correlation between numerical attributes and average monthly listing prices, we can conclude that there is a moderate positive correlation between four attributes.
Correlated attributes are:
- number of bathrooms
- number of bedrooms
- number of beds
- square footage
Moderate positive correlation on monthly listing prices is between 0.51 and 0.64, when describing the strength.

Figure 5: Correlation matrix
Wrapping Up#
1st question#
How much AirBnB homes are earning per month in specific neighborhood areas? When do the prices spike?
The prices peak between June and August and top 3 neighborhoods with highest average monthly prices are: Downtown, Magnolia and Queen Anne, valuing between 188–228 US dollars. If we compare it with the lowest listing price during the peak months, there is approximately 2–3 fold price difference.
2nd question#
What are the busiest times of the year to visit Seattle?
There are two increasing trends, first one in first 5 months of 2016, and second one after the summer until the end of the year, crossing into the January 2017. Period between May and August marks the trend of count decline.
Top 3 months in the year 2016, with the highest listing counts are:
- January
- March
- April
3rd question#
Are there any correlations between any of the numerical attributes and the mean monthly price of listings?
There is a moderate positive correlation (between 0.51 and 0.64) between monthly listing prices and four attributes:
- number of bathrooms
- number of bedrooms
- number of beds
- square footage
GitHub repository#
For more technical details please visit respository on my github repository.
Big thanks to…#
Udacity for giving me an interesting project. AirBnB Inside and Kaggle for sourcing data from publicly available information from the Airbnb site.
Do you want to analyze data from your own city?#
Visit AirBnB Inside, find data of interest, download csv’s and start your data journey.